


Colour is a marketing differential that has significant branding importance for a company’s product range. Whether it’s the practically minded olive drab, or a favourite shade of lavender, the importance of consistency is paramount when producing coloured products for the end consumer. Consider a newly painted room: the perceived difference between a white and an off-white may not be obvious from the tin, however on the wall the results can often provide a stark contrast. It is within this minutia of differences that the importance lies, and this is something that can be investigated as a measurable concept.
The method employed within ITAC’s laboratory is the CIELAB colour space using a handheld spectrophotometer. A spectrophotometer measures reflected light over numerous points from which a spectral curve is produced. These curves are unique to each colour measured and help to develop a fingerprint for a given colour. What makes this instrument useful for a manufacturer is its measurement sensitivity and reproducibility which eliminates the shortcomings of visual perception in the human eye.
The method relies on numerical feedback given when an object or sample is measured and the data is presented as L*, a*, and b*.
These values represent the colour measured and where it sits on a cross-axis of colour and lightness. L* defines the lightness or darkness of a sample where L*= 0 represents black and L*= 100 represents white. The numbers in between these values provide us with invaluable brightness data between the two colours. The a* values can be negative or positive and dictate the colour’s place between red and green – the negative values representing the green and the positive values representing red. The b* values follow the same negative and positive trend; however, they specify the colour’s place between yellow and blue – with the blue end being negative and the yellow end being positive. Together this provides us with the information needed to measure and match colours from one to the other, and importantly, from batch to batch throughout production.
The data provided allows manufacturers to calculate a value known as ΔE (Delta E) or the change in visual perception of two given colours. The ΔE helps us to numerically decide if a particular colour varies from batch to batch. For example, a ΔE of zero would inform us that the two batches are a perfect match, whereas a ΔE of 2-10 is certainly not a match and differences are perceptible immediately. ΔE of <=1.00 is the gatekeeping value in colour difference that cannot be detected by the human eye. This tolerance can change depending on the specific batch. For example, some colours with a greater value than ΔE=1 cannot be perceived by the human eye. Other brighter colours will always struggle to obtain a lesser value than ΔE=1.
Below is an example taken from historical lab data of shades of grey that illustrate the subtle differences that can be achieved through varying ΔE.
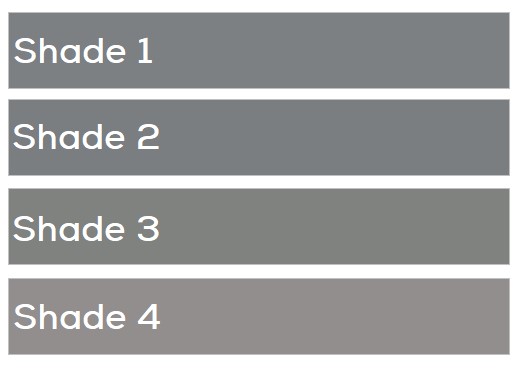
The ΔE between shade 1 and shade 2 is 0.74; this is imperceptible to the human eye despite there being a difference in the L* values. Comparing shade 1 to shade 3 reveals a ΔE value of 2.86 – the difference is perceptible immediately as the brightness has changed but there is also introduction of yellow. Finally, comparing shade 1 to shade 4 reveals the biggest difference with a ΔE value of 6.83 which sees another increase in brightness and slightly more yellow. In terms of lab trials, Shade 1 and shade 2 would be acceptable with no perceivable differences, however shade 3 and shade 4 would not be accepted.
This short article has discussed how colour can be measured to ensure successful alignment with the application, its manufacture, and end use performance requirements. Further information on ITAC’s colour testing capabilities can be found by contacting Tyler Coleman, Technical Manager, on 01204 573736 or by email at TColeman@itac.uk.com.


